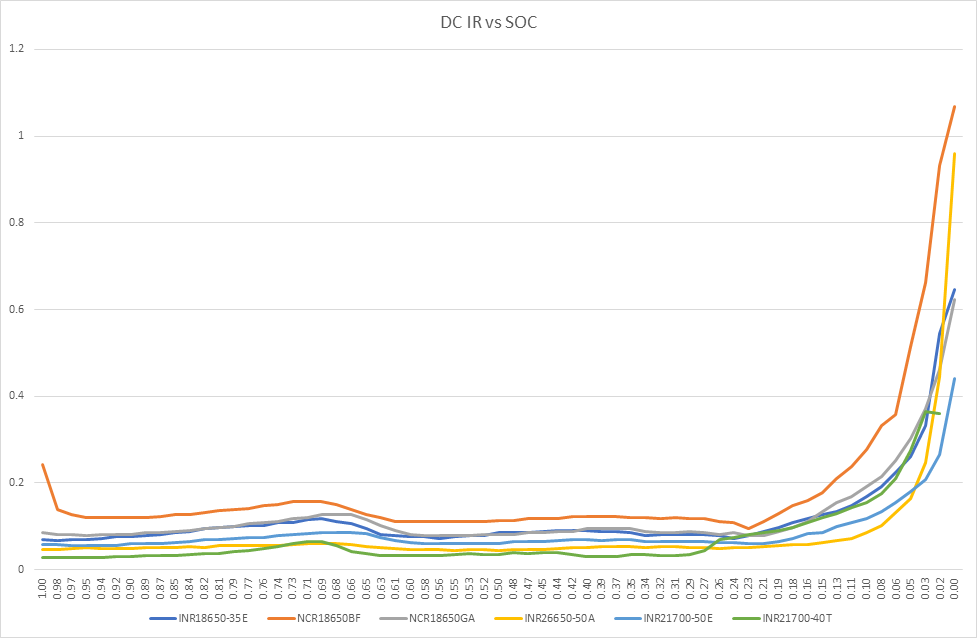
DC IR vs SOC (VII)
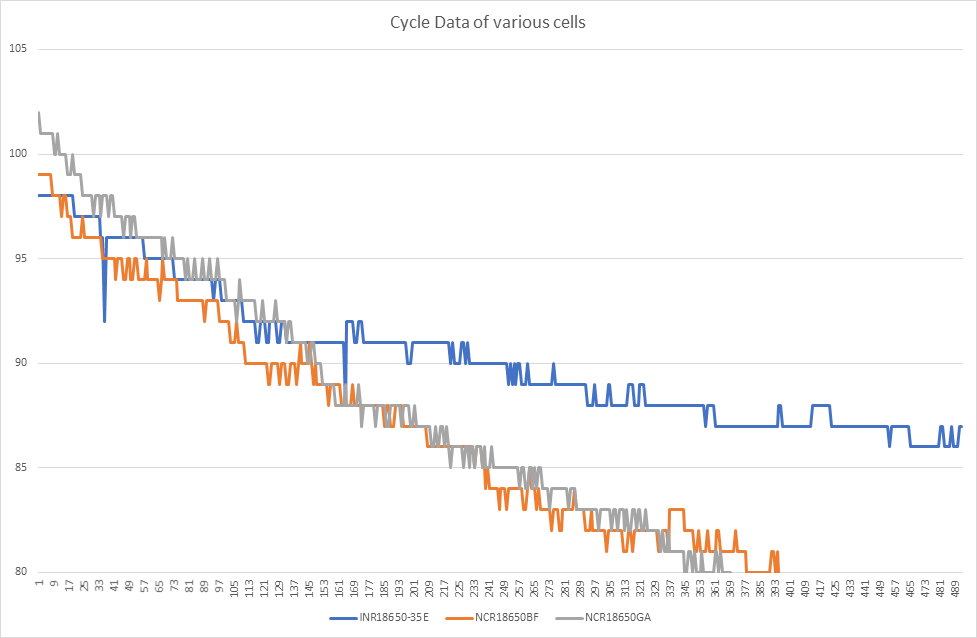
Death by cycling data update.
Both the NCR18650BF and NCR18650GA cells have reached 80%, similar cycling performance although the BF cell was under 0.5C (1.625A) load, whereas the GA cell was under 1C (3.35A). I chose the different loads to better reflect how these cells would be used. The INR18650-35E looks to have a better cycling life under the same test conditions as the GA cell.
Internal resistance data at various SOH. I am defining SOH as the percentage of original capacity. State of health could be defined according to the IR of the cell. IR as a measure of SOH might be used in a power application where the internal resistance of the cell matters when it is under a heavy load.
Last fun graph for today. These show the IR at 50% SOC when the cell is new, at 90% SOH and 80% SOH. The increase in IR is not linear as the cell ages. The INR18650-35E increase was higher when going from 100% to 90% SOH than the other cells, it will be interesting to see how that plays out when the cell reaches 80% of its original capacity.


